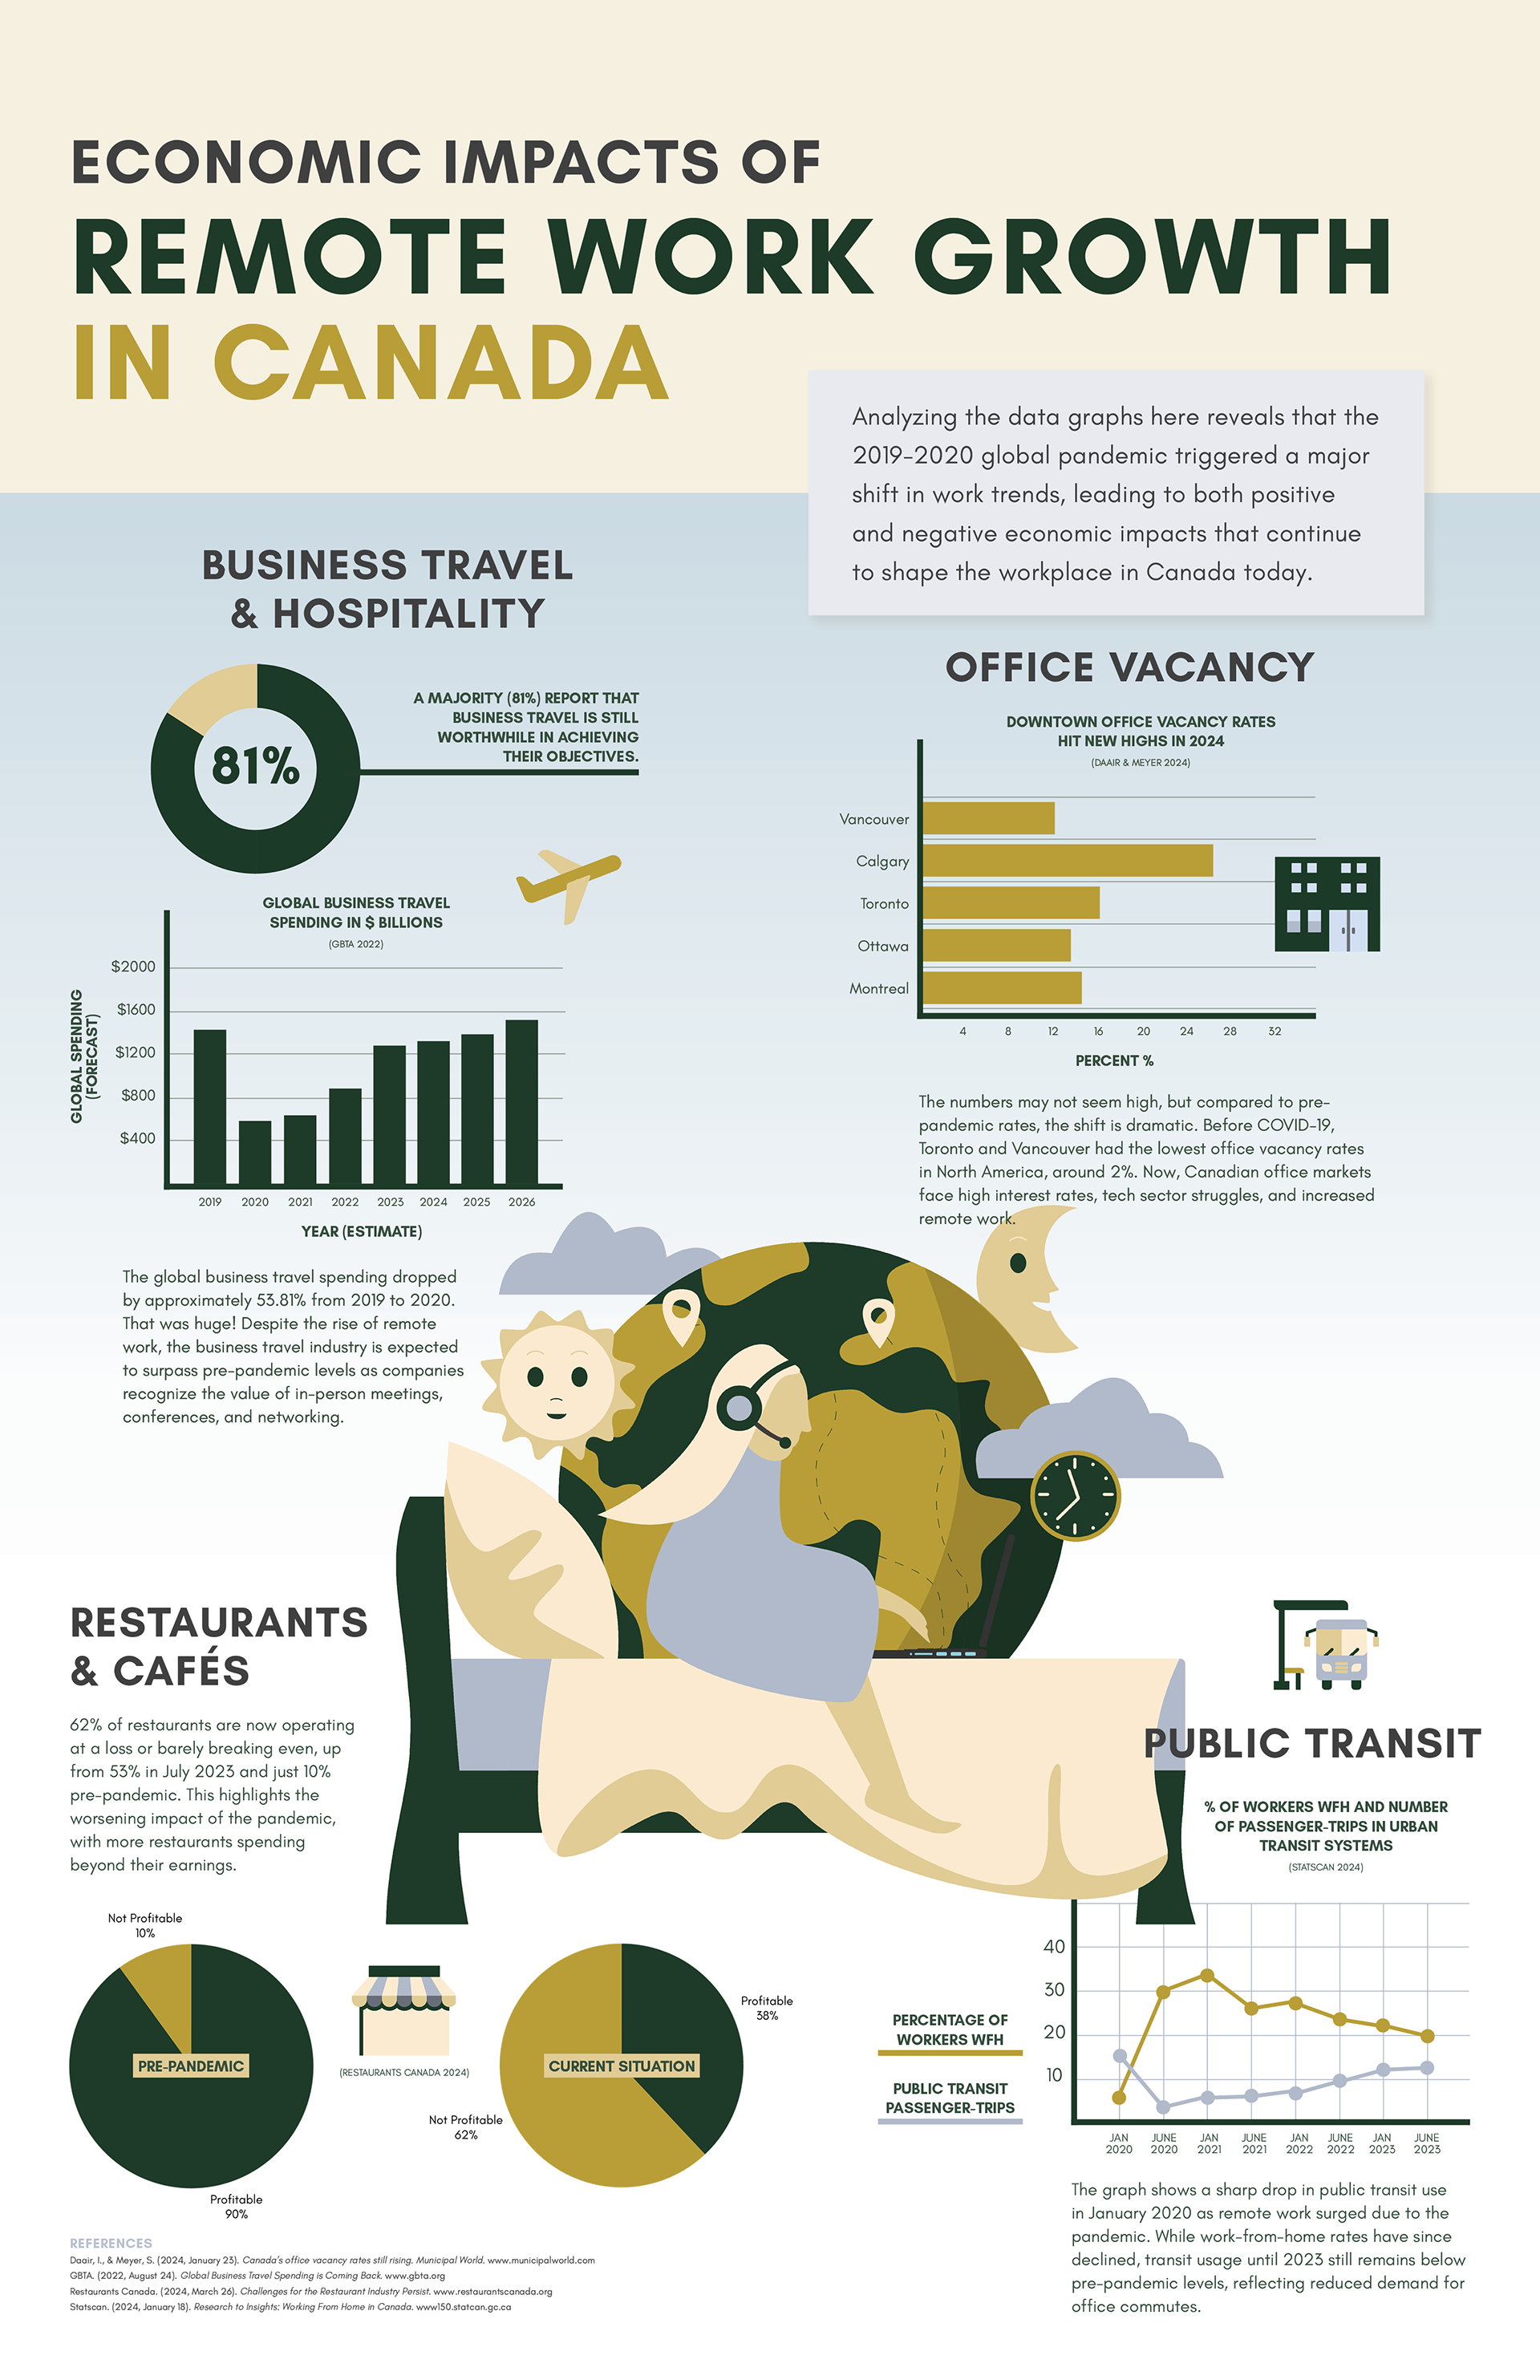
This infographic explores the economic impact of remote work in Canada, highlighting both the benefits and challenges. I developed the concept, designed all vector illustrations, and created four custom data visualizations (donut chart, pie chart, bar chart, and line graph) across four key subtopics. The final deliverables included both a static flyer and an animated version, showcasing my skills in illustration, data storytelling, and motion graphics.